The Very, Very Simple Climate Model
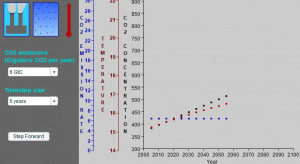
What would happen if we released more or less carbon dioxide (CO2) into the atmosphere? Find out with the Very, Very Simple Climate Model. This model will calculate the amount of CO2 in the atmosphere and the average global temperature based on CO2 emissions.
First decide how much CO2 will be released into the atmosphere each year and set the CO2 emissions rate. In the year 2000, we released 6 Gigatons of CO2 into the atmosphere. Do you think we will be releasing more or less in the future?
Then set the Timestep depending on how far you want the model to jump ahead into the future.
Click the Step Forward button to see how temperature and CO2 change. Click Step Forward several times until you’ve filled the graph to the year 2100.
What does this graph mean?
Blue dots (and blue y-axis scale) show how much carbon dioxide we add to the atmosphere each year. This is measured in Gigtatons of CO2 (GtC) per year. That’s how much CO2 you decided humans would release.
Black dots (and black y-axis scale) show how much carbon dioxide has built up in the atmosphere over time. This is measured in parts per million by volume (ppmv). The actual amount was around 368 ppmv in the year 2000.
Red dots (and red y-axis scale) shows average global temperature in degree Celsius. For reference, this value was around 14.3° C in the year 2000. In this simple model, temperature is based entirely on the atmospheric CO2 concentration via greenhouse warming.

